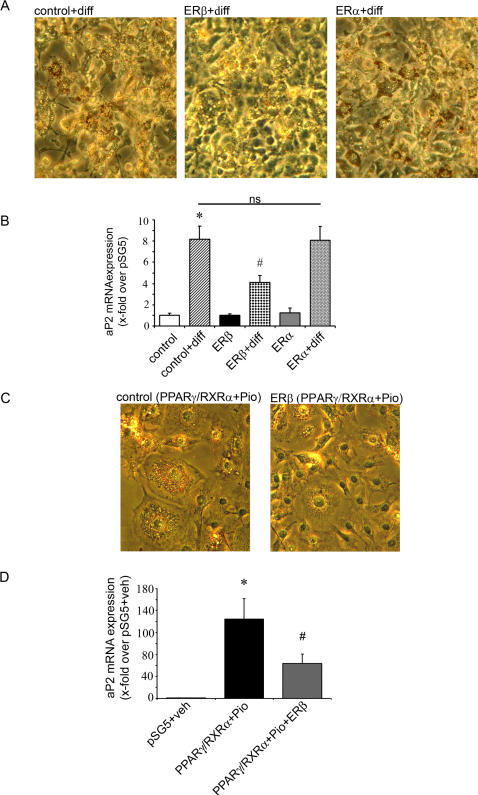
Figure 2. ERβ inhibits PPARγ-dependent adipocyte differentiation and target gene expression.
A) 3T3-L1 preadipocytes were transfected with the indicated plasmids and cells were treated with differentiation mix (diff) for 3 days, as indicated. Representative phase-contrast images (20×magnifications) after Oil-Red-O staining are shown. B) 3T3-L1 preadipocytes were transfected with the indicated plasmids and cells were treated with differentiation mix (diff) for 3 days as indicated. mRNA expression of aP2 level is shown, as indicated. Real Time quantitative RT-PCR studies were carried out using total RNA. * p<0.05 vs. control, # p<0,05 vs. control+diff; ns: not significant vs. control+diff. C) 3T3-L1 preadipocytes were transfected with the indicated plasmids and cells were treated with 10 µM pioglitazone for 3 days, as indicated. Representative phase-contrast images (40×magnifications) after Oil-Red-O staining are shown. D) mRNA expression of aP2 levels measured in transfected cells treated with 10 µM pioglitazone for 3 days, as indicated. Real Time quantitative RT-PCR studies were carried out using total RNA. * p<0.05 vs. pSG5+veh, # p<0.05 vs. PPARγ/RXRα+Pio. Values represent means±SEM of at least three independent experiments performed in triplicates.

