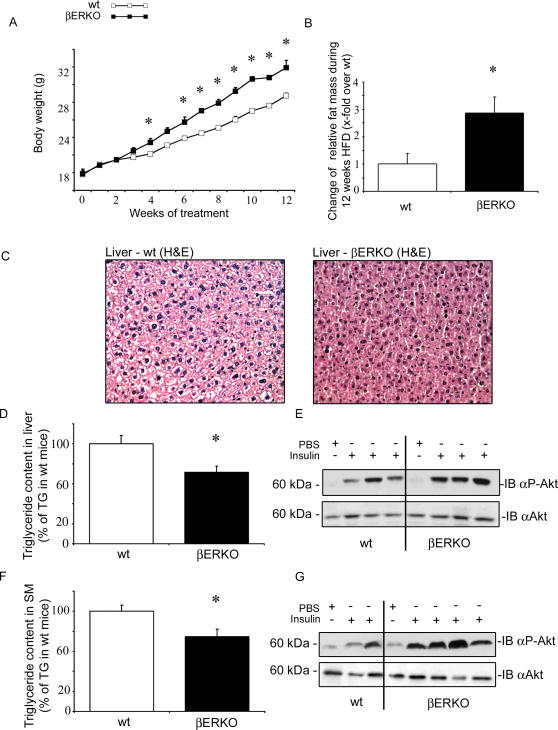
Figure 5. βERKO mice exhibit improved hepatic and muscular insulin signaling.
A) Body weight development of HFD-fed wt and βERKO mice. * p<0.05 vs. wt-control. B) Change of relative fat mass during 12 weeks of HFD, presented as x-fold over wt mice. * p<0.05 vs. wt-control C) H&E-stained liver section from HFD-fed wt and βERKO mice. Representative images (20×magnifications) are shown. D+F) Relative TG content in liver and skeletal muscle of HFD-fed wt and βERKO mice (n = 5 per group). * p<0.05 vs. wt-control. E+G) Phosphorylation of Akt kinase in liver and muscle after insulin challenge, as described in Materials and Methods. Representative Western blot analyses using pS473-Akt and total-Akt antibodies are shown.

