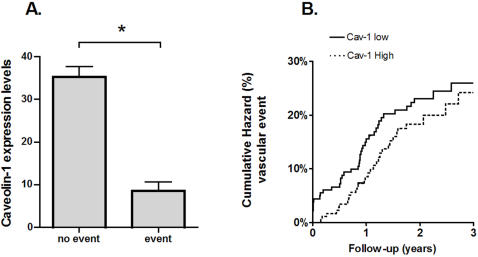
Figure 4. Caveolin-1 and Vascular Outcomes during Follow-up.
A - Caveolin-1 expression levels in the plaque in relation the occurrence of an adverse vascular event within 30 days follow-up. *: p = 0.03. B - Cumulative hazard of vascular events during long-term follow-up. The solid line corresponds to patients with Cav-1 levels smaller than the median, and the dashed line corresponds to patients with Cav-1 levels larger than or equal to the median. Hazard ratio = 0.77 [0.48–1.23] (high vs. low Caveolin-1 expression)

