Figure 2.

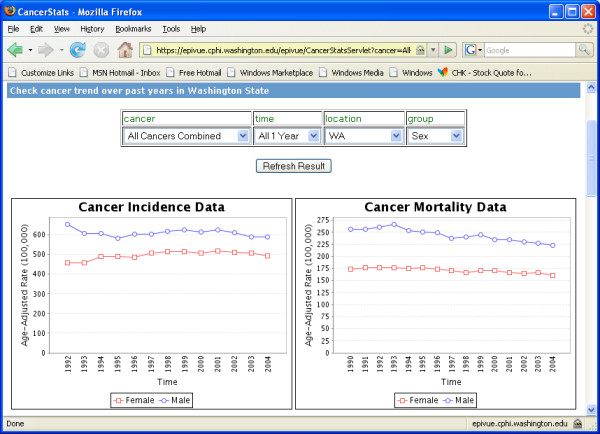
Line charts displaying the trends of cancer incidence and mortality age-adjusted rates/100,000 in Washington State over a multi-year period.

Line charts displaying the trends of cancer incidence and mortality age-adjusted rates/100,000 in Washington State over a multi-year period.