
Figure 2.
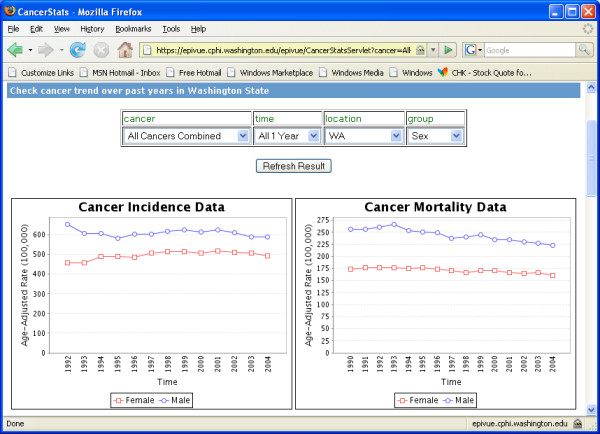
Line charts displaying the trends of cancer incidence and mortality age-adjusted rates/100,000 in Washington State over a multi-year period.
Official websites use .gov
A
.gov website belongs to an official
government organization in the United States.
Secure .gov websites use HTTPS
A lock (
) or https:// means you've safely
connected to the .gov website. Share sensitive
information only on official, secure websites.
Line charts displaying the trends of cancer incidence and mortality age-adjusted rates/100,000 in Washington State over a multi-year period.