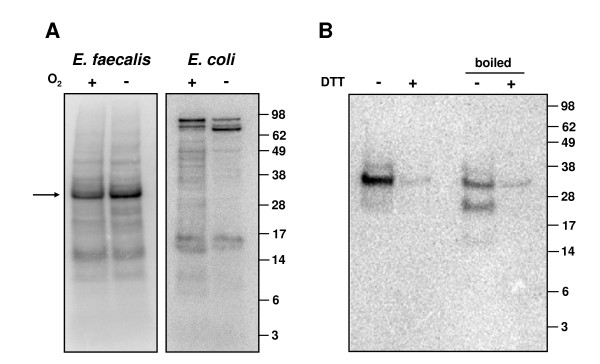
Figure 6.
Metabolic labeling of E. faecalis with 75Se and analysis of Se-binding proteins. (A) E. faecalis and E. coli were metabolically labeled under aerobic and anaerobic conditions. 30 μg of total protein from each organism were resolved by SDS-PAGE gel and transferred onto a PVDF membrane. 75Se patterns were visualized with a PhosphorImager. Molecular masses of protein standards (in kilodaltons) are shown on the right. (B) Se-containing proteins were heated or treated with DTT. 30 μg of total protein from each organism were resolved by SDS-PAGE gel and transferred onto a PVDF membrane. 75Se patterns were visualized with a PhosphorImager. Molecular masses of protein standards (in kilodaltons) are shown on the right.

