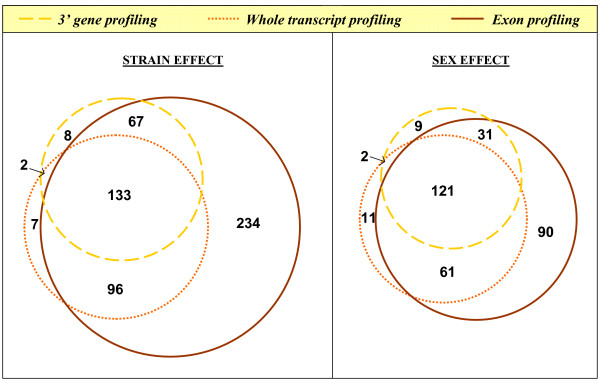
Figure 4.
Comparison of 3' gene expression profiling, whole-transcript gene expression profiling and exon expression profiling. Venn diagram illustrating the overlap between genes identified using 3' gene expression profiling, whole-transcript gene expression profiling and genes associated with an exon identified using exon expression profiling for strain- and sex-bias expression.

