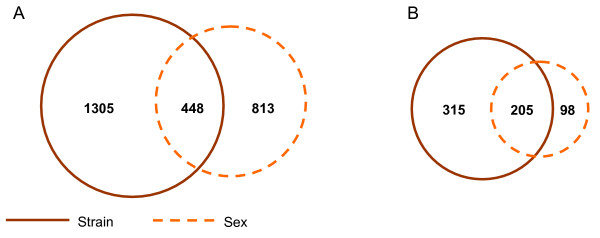
Figure 6.
Genes showing both strain- and sex-biased effects. Venn diagrams showing A) the overlap between exons showing strain effects and those with sex effects and B) the overlap between genes with differentially expressed exons showing strain effects and those with sex effects. For the diagram shown in (B), we restrict the analysis to genes that utilizes different exons for strain- and sex-bias expression (see text).

