
Figure 1.
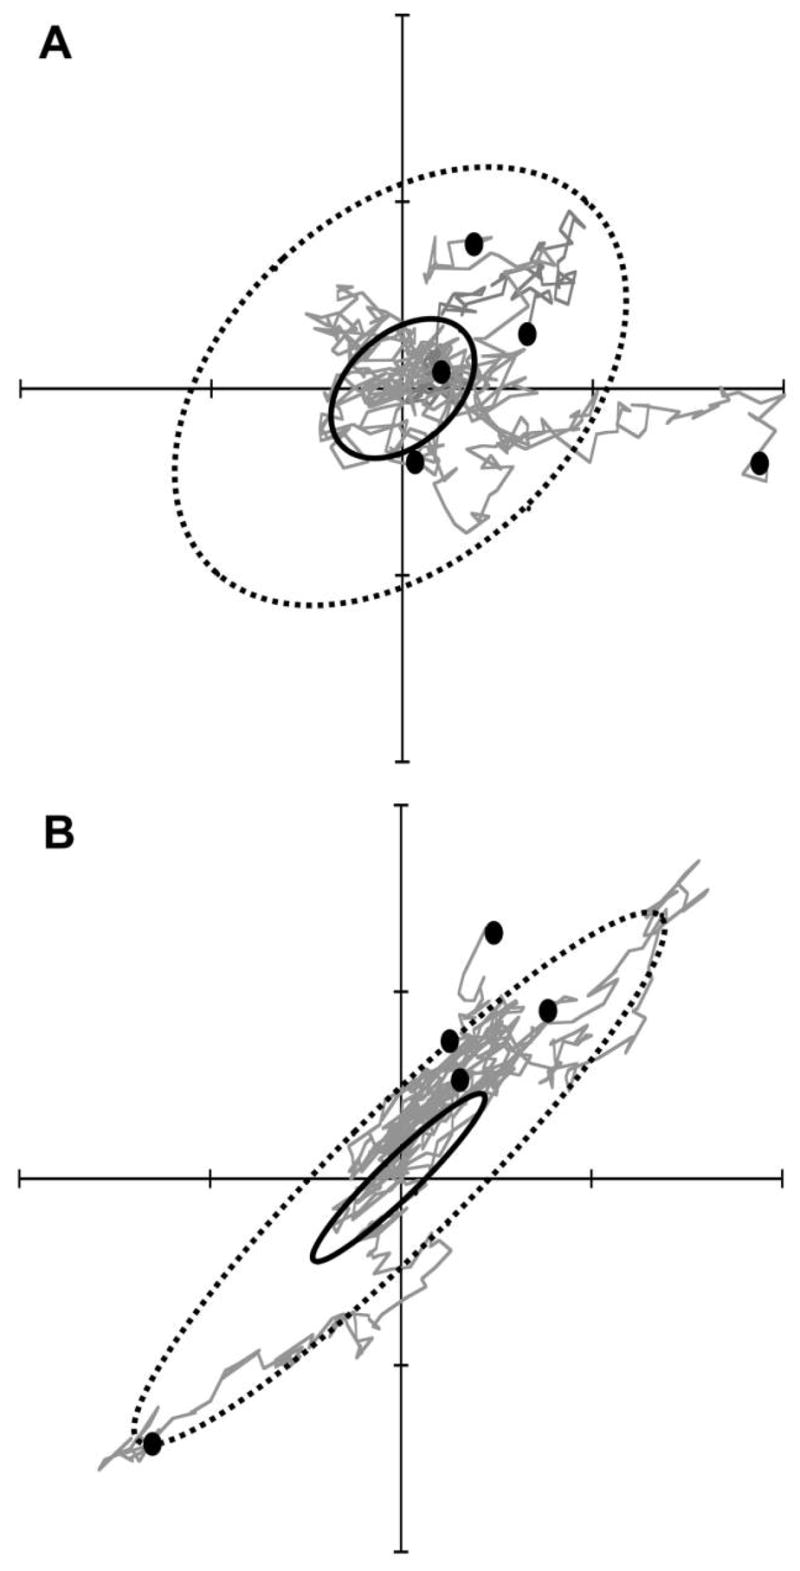
Two examples showing that the theoretical pattern of neutral divergence is proportional to the G matrix. The axes in each plot represent population mean values of two traits. A, Five simulated replicate populations share a common G matrix for two traits and have evolved independently by drift from a single common ancestor with trait values at the center of the plot. Evolution of the five populations was simulated for 1,000 generations, with final populations shown as dots. The G matrix (solid ellipse) is plotted as a 95% confidence ellipse. The five replicate populations represent a sample from a predicted probability distribution of divergence, represented by the D matrix (dashed ellipse). In this example, Ne = 100, so at t = 1,000 generations, D(t) = 10G (eq. [3]). B, Identical simulation conditions as in A, except that G has a different shape (ratio of eigenvalues), producing a different prediction for divergence, D(t).