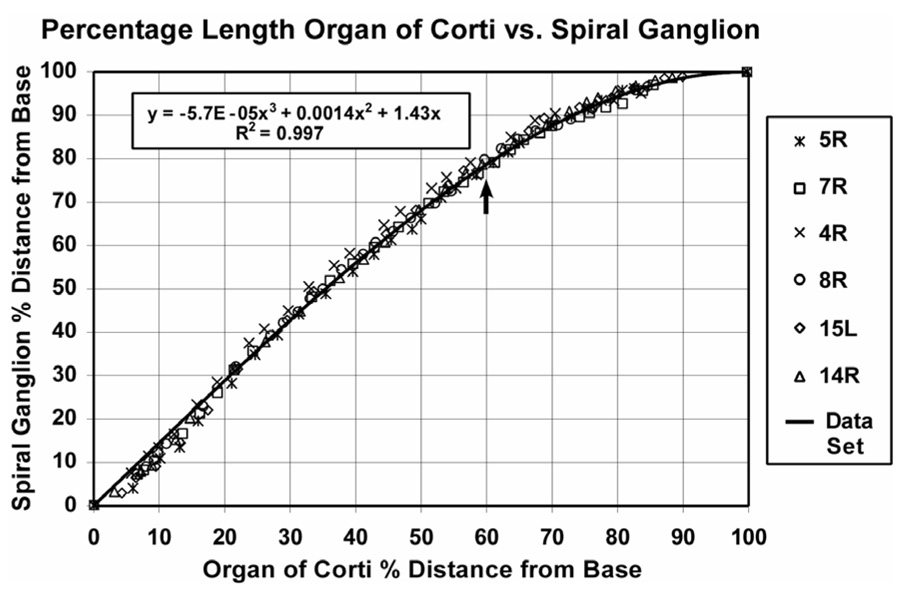
Figure 2.
Frequency-matched points along the OC and SG were determined by tracing the trajectories of radial nerve fibers. These data are plotted here for the 6 cochleae in our data. A good correlation between percentage length along the organ of Corti and percentage length along the SG was demonstrated (r2>0.99). The data were well fit by the cubic function shown in the graph. Mean location for V is indicated by arrow (see text).

