
Fig. 1.
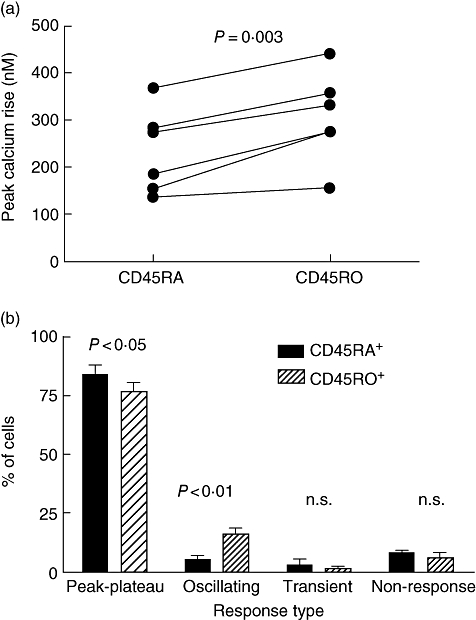
Magnitude and patterns of calcium responses are different in CD45RO+ and CD45RA+ T cells isolated from peripheral blood. (a) CD4+ CD45RA+ and CD4+ CD45RO+ T cells were isolated from the peripheral blood of the same donor, loaded with Indo-1 and calcium responses to 10 μg/ml phytohaemagglutinin (PHA-P) acquired using a fluorimeter with cells in suspension. Paired data from six different donors is shown, and plotted is the rise between baseline and maximum provoked by the lectin. (b) CD4+ CD45RA+ and CD4+ CD45RO+ T cells were isolated from the PB of the same donor, loaded with Fura-2 and calcium responses to 10 μg/ml PHA-P imaged over a period of up to 20 min. For each donor this was repeated two to three times on different cells from each population. Each cell was analysed individually and assigned to one of the four calcium patterns (peak–plateau, oscillating, transient or non-response). Shown are results from three donors; between 70 and 270 cells of each type were analysed on each occasion. The data shown were derived from 447 CD45RA+ cells and 649 CD45RO+ cells.