
FIGURE 7. Redox influence on Ku structure.
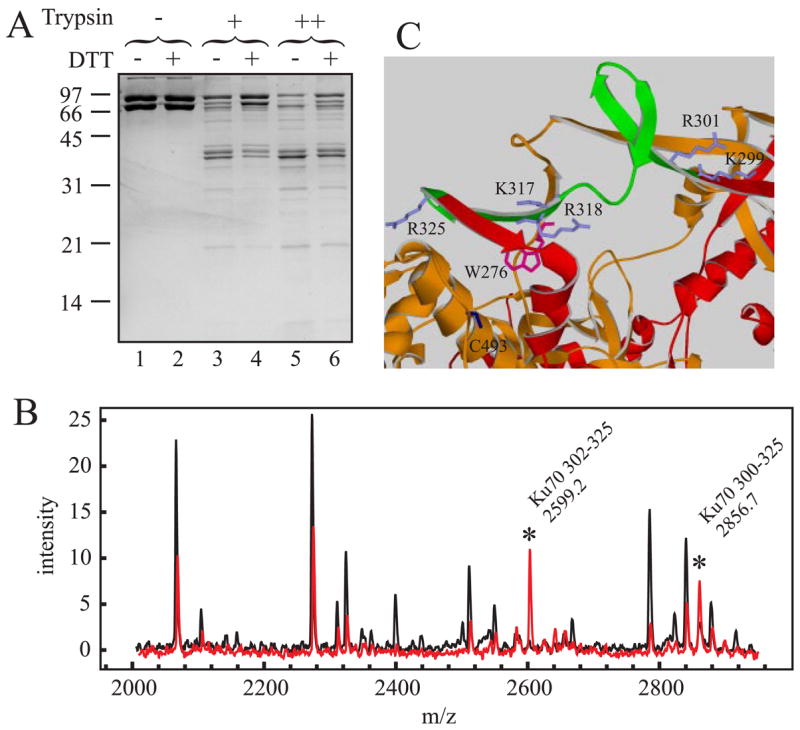
A, SDS-PAGE analysis of Ku proteolytic sensitivity. 7.5 μg of Ku was subjected to limited proteolysis as described under ”Experimental Procedures.“ Digestion reactions were performed in the absence of trypsin (lanes 1 and 2), with 12.8 ng of trypsin (lanes 3 and 4) or with 32 ng of trypsin (lanes 5 and 6). Reactions were performed without the addition of DTT (odd lanes) or with the addition of DTT to a final concentration of 1 mM (even lanes). Reaction products were separated by 10% SDS-PAGE and visualized via Coomassie Blue staining. B, MALDI-TOF MS analysis of trypsin generated Ku peptides. 7.5 μg of Ku was subjected to limited proteolysis, processed for MALDI-TOF analysis, and spectra collected as described under ”Experimental Procedures.“ The spectra presented are from a 32-ng trypsin reaction performed in the absence of DTT (black trace) or in the presence of DTT (red trace). Peaks were labeled showing the region of Ku70 that is uniquely cut under reducing conditions. Spectra presented are representative of data obtained at all concentrations from three independent experiments and were normalized to an internal peptide standard. C, structure of the Ku-DNA binding ring. The regions of Ku70 (red) and Ku80 (orange) that comprise the DNA binding ring are depicted in a ribbon diagram. The 301–324 peptide observed in trypsin digestions reactions performed in the presence of DTT is colored green. Ku70 amino acid side chains of Lys-317, Arg-318, Lys-299, Arg-301, and Arg-325 are colored gray. The Ku80 amino acid side chains of Trp-276 are colored magenta and Cys-493 in blue.