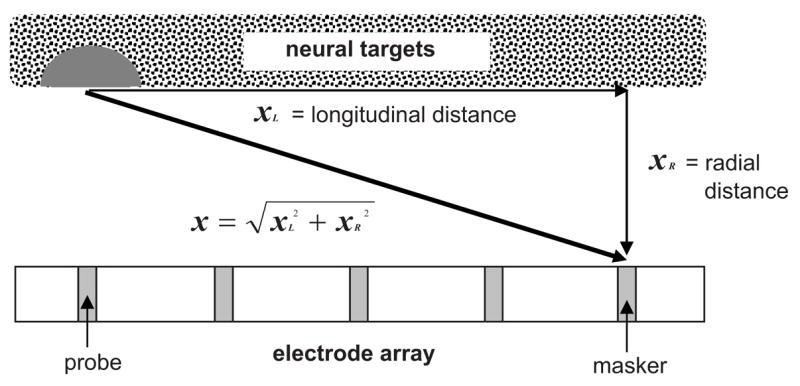
FIG. 10.

Schematic demonstrating the spatial relationship between the masker electrode and the neural targets activated by the probe electrode. The horizontal dimension represents longitudinal distance along scala tympani; the vertical dimension represents radial distance between the electrode array and neural targets residing within the modiolus. The dark gray semicircle represents neural targets activated by the low-amplitude probe stimulus.
