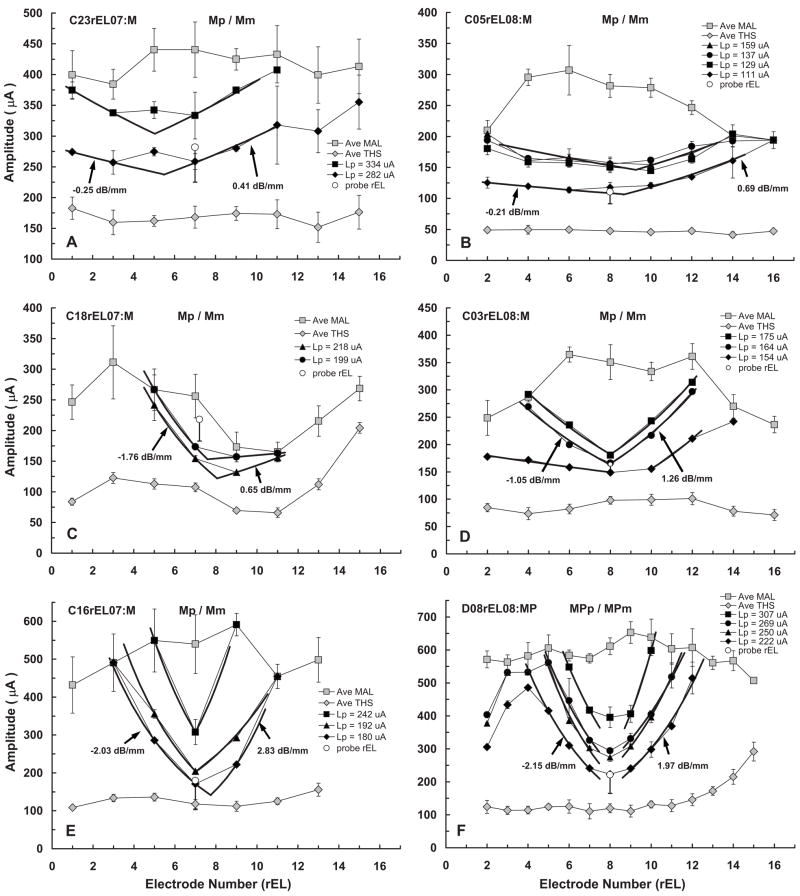
FIG. 3.
fmSTCs for six Clarion cochlear-implant users who were stimulated using a monopolar electrode configuration. The horizontal position of the open circle in each graph identifies the probe electrode; probe level is indicated by the vertical position of this symbol, with the height of the vertical line indicating the sensation level of the probe; the horizontal line below the open circle indicates the subject’s absolute threshold for the probe stimulus. For clarity, only the lowest probe level is plotted. Other features of the individual graphs are the same as those described for Fig. 2.

