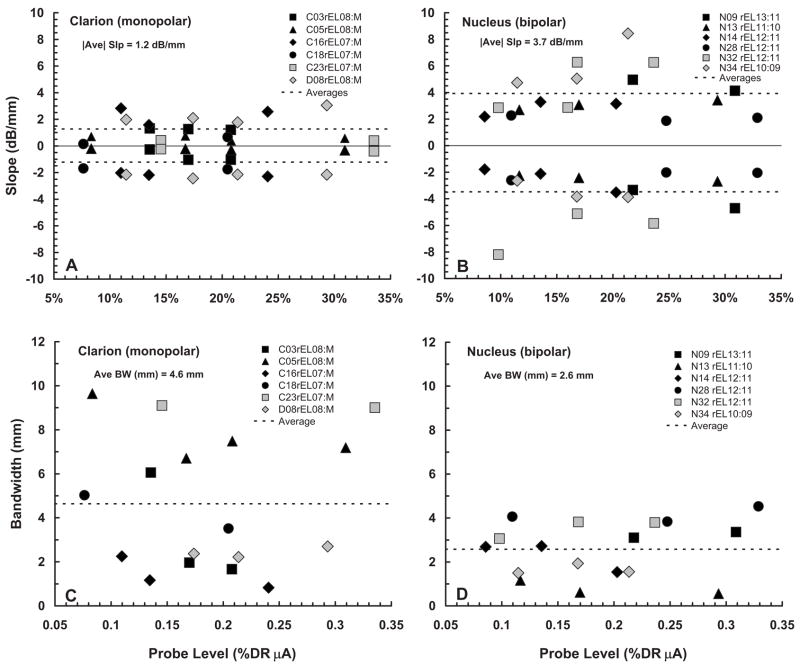
FIG. 5.
fmSTC slopes and bandwidths. Slopes (dB/mm) of the fmSTCs obtained from Clarion subjects (A) and Nucleus subjects (B) are shown as a function of probe level, expressed as a percentage of the probe dynamic range in microamperes. In each panel, apical slopes are plotted as negative values and basal slopes are plotted as positive values. Different symbols represent different subjects, as indicated in the legends of each graph, and dashed lines indicate the average slopes for each group. The average of the absolute values (disregarding sign) of both apical and basal slopes is indicated under the heading of each graph. Q1 dB bandwidths (mm) of fmSTCs obtained from Clarion subjects (C) and Nucleus subjects (D) are shown as a function of probe level, which is expressed as a percentage of the probe dynamic range in μA. Different symbols represent different subjects, as indicated in the legends of each graph. The average Q1 dB bandwidth for each group is shown by the horizontal dashed line and is given under the heading of each graph.

