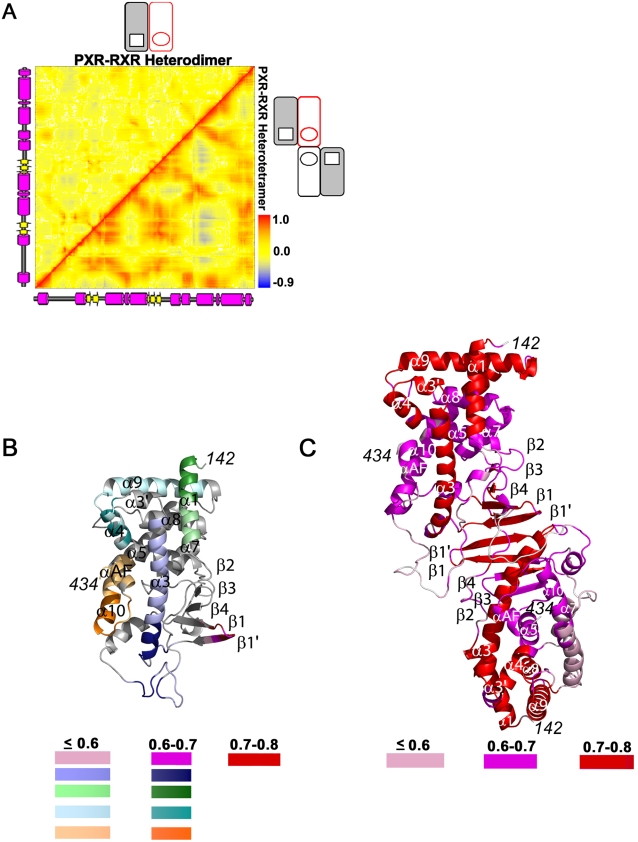
Figure 3. Highly Correlated Motion in the PXR-RXR Heterotetramer.
(A) Covariance analysis of the PXR LBD in the PXR-RXR heterodimer and heterotetramer. Residue-residue correlation coefficient values range from blue (anticorrelated, –0.9) to red (correlated, +1), with uncorrelated residue pairs in yellow. Secondary structure is provided from right-to-left, and bottom-to-top. (B) Clustering of correlated PXR LBD residues from the PXR-RXR heterodimer simulation. Eleven clusters were identified, five with a correlation cutoff (CC) of 0.6, five with a CC of 0.7, and one with a CC of 0.8. (C) Clustering of correlated PXR LBD residues from the PXR-RXR heterotetramer simulation. Three clusters were identified, one each with CCs of 0.6, 0.7, and 0.8. Clusters are colored by the maximum correlation coefficient at which they are observed.

