
Figure 2.
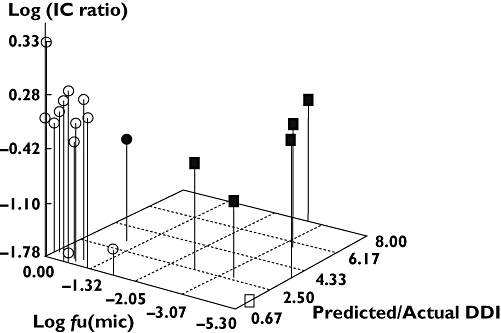
Representative 3-D scatter plot of the log of the microsomal unbound fraction (fu(mic)) vs. the log of the ratio of the intrinsic clearance (IC ratio) in rhCYPs/intrinsic clearance in HLMix-101 vs. ratio of the predicted/actual DDI. Compounds whose predicted values were outside of the two-fold boundary are shown in black. The squares represent compounds which have an unbound fraction of < 0.1