Figure 1.

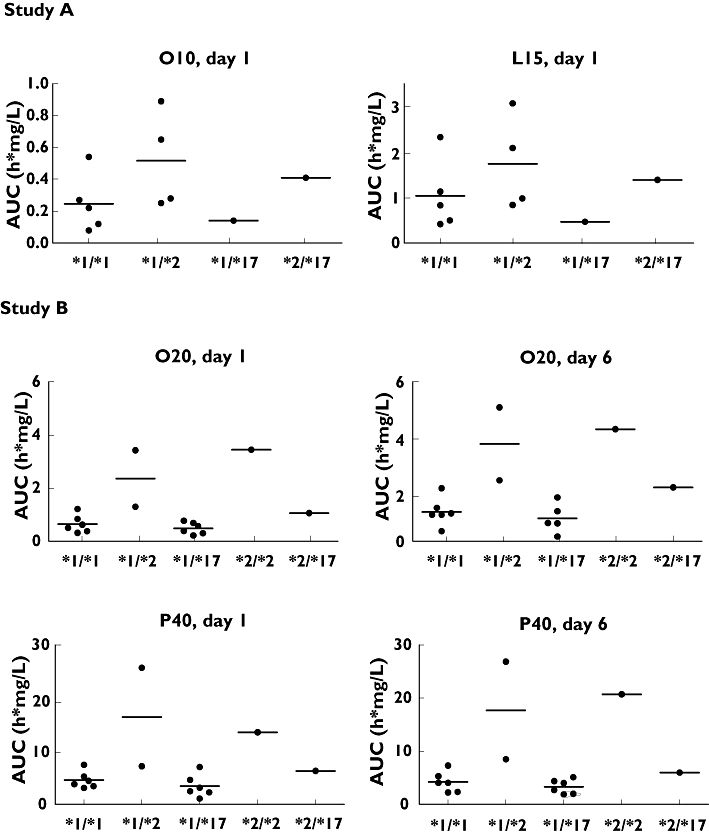
Individual and mean (horizontal bar) AUC of *1/*1, *1/*2, *1/*17, *2/*2 and *2/*17 genotypes after administration of L15, O10, O20 and P40 on day 1 (study A and B) and day 6 (study B)

Individual and mean (horizontal bar) AUC of *1/*1, *1/*2, *1/*17, *2/*2 and *2/*17 genotypes after administration of L15, O10, O20 and P40 on day 1 (study A and B) and day 6 (study B)