
Figure 2.
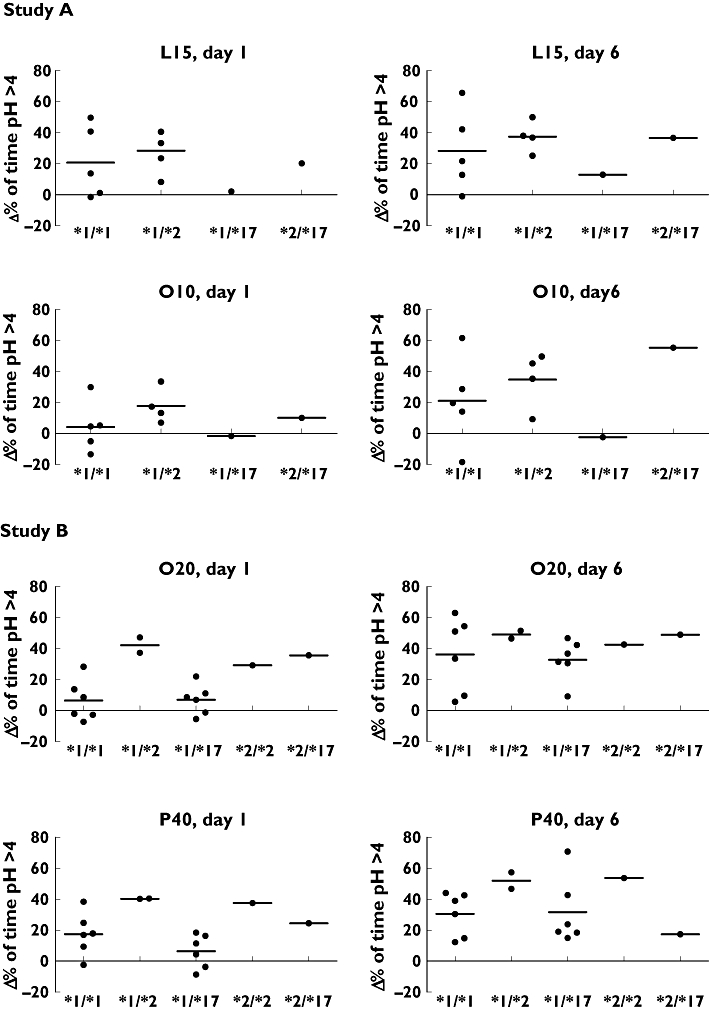
Individual and mean (horizontal bar) responses of *1/*1, *1/*2, *1/*17, *2/*2 and *2/*17 genotypes to L15, O10, O20 and P40 on day 1 and day 6, corrected for baseline (Δ percentage of time pH > 4)
Official websites use .gov
A
.gov website belongs to an official
government organization in the United States.
Secure .gov websites use HTTPS
A lock (
) or https:// means you've safely
connected to the .gov website. Share sensitive
information only on official, secure websites.
Individual and mean (horizontal bar) responses of *1/*1, *1/*2, *1/*17, *2/*2 and *2/*17 genotypes to L15, O10, O20 and P40 on day 1 and day 6, corrected for baseline (Δ percentage of time pH > 4)