
Figure 1.
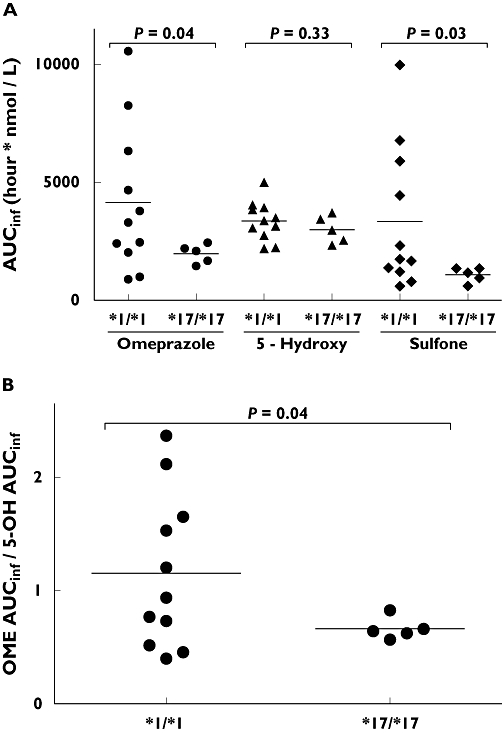
(A) Distribution of area under the concentration–time curve (AUC∞) values for omeprazole, 5-hydroxyomeprazole (5-hydroxy) and omeprazole sulphone (sulphone) in relation to CYP2C19*17/*17 (n = 5) and CYP2C19*1/*1 (n = 11) genotype. (B) Distribution of the ratio of area under the concentration–time curves of omeprazole (OME AUC∞) and 5-hydroxy omeprazole (5-OH AUC∞) in relation to CYP2C19*17/*17 (n = 5) and CYP2C19*1/*1 (n = 11) genotype. Bars represent mean values. Statistical analyses were performed with an unpaired two-tailed heteroscedastic t-test