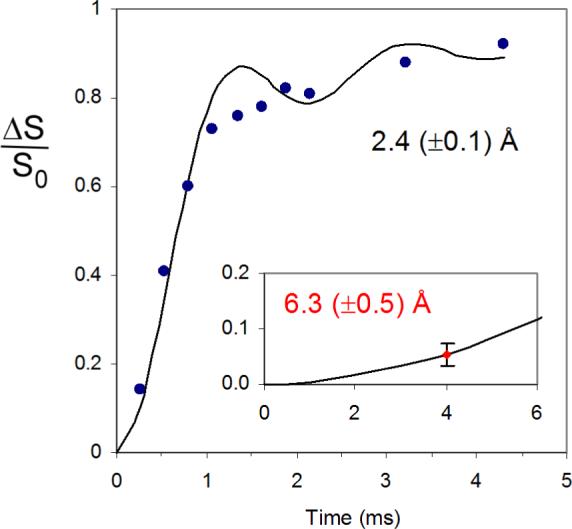
Figure 4.

2H{19F} REDOR dephasing (ΔS/S0) for the alanine sample of Figure 2. The experimental dephasing (solid black circles) is consistent with that calculated using SIMPSON (solid black line) assuming a single 2H-19F distance of 2.4 Å. The corresponding REDOR spectra are shown in the Supplemental Material (Figure S2). The inset shows the REDOR dephasing (red) for tubulin-bound paclitaxel analog 5 after 32 rotor cycles of dipolar evolution with magic-angle spinning at 8 kHz. The REDOR spectra are shown in the Supplemental Material (Figure S3). These spectra resulted from the accumulation of 1,056,000 scans. The experimental dephasing is consistent with that calculated using SIMPSON (solid black line) assuming a single 2H3-19F distance of 6.3 Å and the 19F chemical-shift and 2H quadrupolar tensor parameters of Figure S4 of the Supplemental Material. The minor effects of C3 motional averaging were ignored.
