
Table 2.
Interatomic distances for PTX conformations as compared to REDOR-determined separations for PTX on tubulin.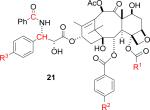
| Distance, Å | |||||||
|---|---|---|---|---|---|---|---|
| Separation | Cmpd | Polar modela | Nonpolar modelb | PTX-NY modelc,d | 1JFFe | T-Taxol modeld,f | REDOR distance |
| R1-R2g | 4 | 7.4 | 8.0 | 7.3 | 6.5 | 7.9 | 7.8h |
| R1-R3g | 5 | 5.5 | 7.2 | 6.4 | 7.2 | 6.6 | 6.3h |
| R2-R3 | 4 | 4.5 | 12.5 | 13.3 | 11.6 | 12.2 | >8h |
| R2-CH | 2 | 9.6 | 8.5 | 9.4 | 9.3 | 9.9 | 10.3i |
| R2-C | 2 | 10.4 | 6.2 | 10.0 | 8.1 | 9.1 | 9.8i |
a
Mastropaolo, D.; Camerman, A.; Luo, Y.; Brayer, G. D.; Camerman, N. Proc. Natl. Acad. Sci. U.S.A. 1995, 92, 6920−6924.
b
Williams, H. J.; Scott, A. I.; Dieden, R. A.; Swindell, C. S.; Chirlian, L. E.; Francl, M. M.; Heerding, J.; Krauss, N. E. Tetrahedron, 1993, 49, 6545−6560; Ref. 13.
c
Ref. 18.
e
Ref. 5.
f
Ref. 7.
g
Distances from the 4-OAc methyl group were taken as an average of the three hydrogen positions.
h
This work, ± 0.5 Å
i
Ref. 15.