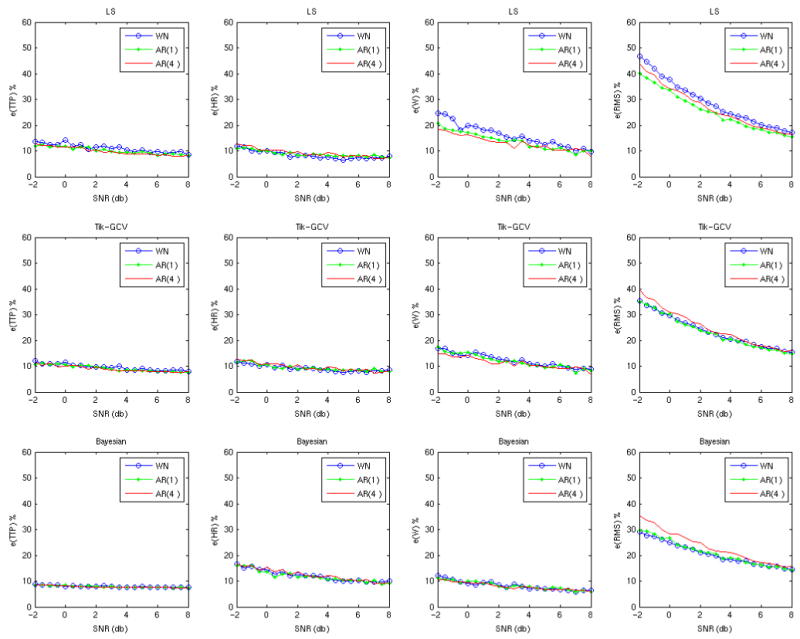
Figure 2.

The estimation error of the three methods (rows) when noise with different structure (colored lines) is added to the data with a short ITI. The ITIs were generated using an exponential distribution with ITImean = 3 s, ITImin = 1 s, TR = 1 s and the grid size equal to TR. In this case with a relatively short ITI the estimates are quite robust to the degree of noise autocorrelation.
