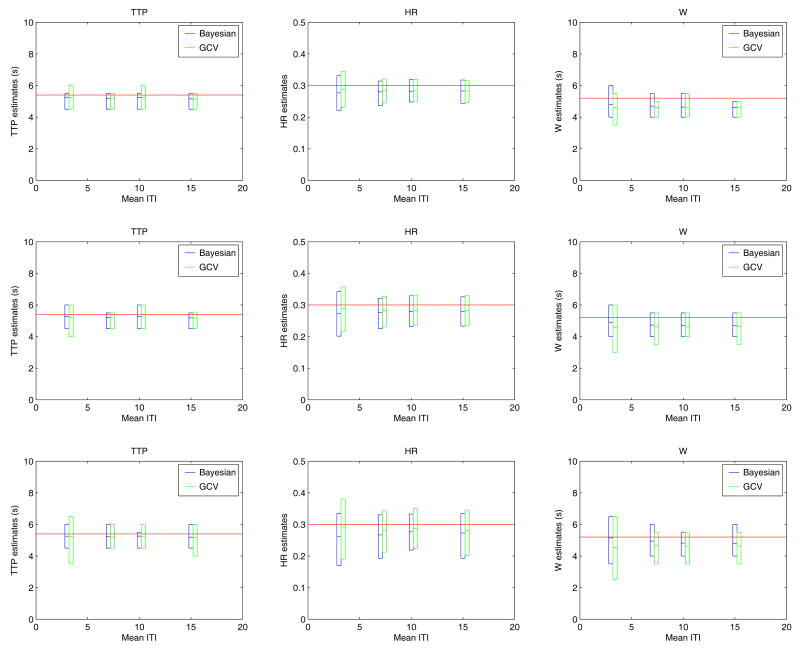
Figure 5.
The comparative performance of both regularization techniques in terms of accuracy and variability is illustrated for TR = 2 s, grid size TR/4 and 4 different ITImean (3, 7, 10 and 15 s) and exponential sequences. The bars represent the mean value and the 2.5 % lower and upper tails of the estimates. The horizontal lines stand for the real parameters values. The upper, middle and bottom rows correspond to noise levels of 5, 3 and 0 db respectively.

