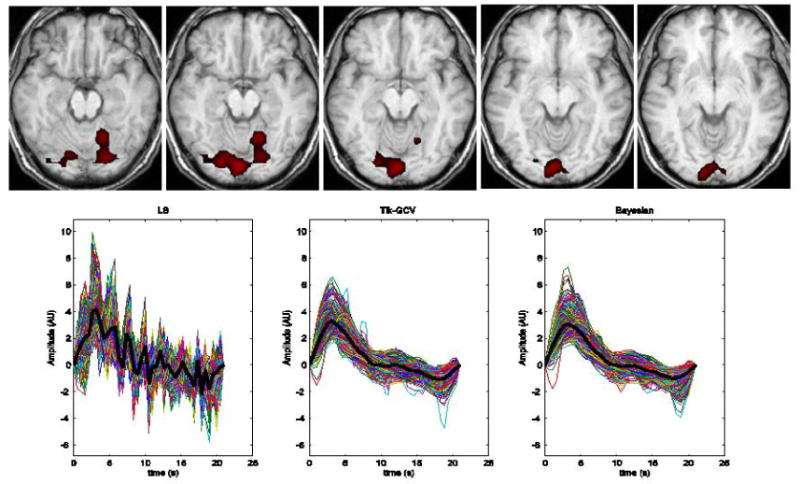
Figure 7.

In the upper row, slices of a significantly activated area (p < 0.05 cluster corrected) of the visual cortex are shown. Estimates of the HRF were based on all voxels within this region of significant activation as determined using SPM99. The voxel wise HRF estimate produced by the 3 methods are displayed in the bottom row with the corresponding average HRF across the activated area shown as black thick lines. The LS method becomes very unstable while the regularization based methods are able to produce meaningful results. The estimated values for (TTP, HR, W) produced by LS, Tik-GCV and the Bayesian methods are (3.15 s, 4.16, 2.1 s), (3.15 s, 3.27, 4.72 s) and (3.15 s, 3.07, 4.73 s) respectively.
