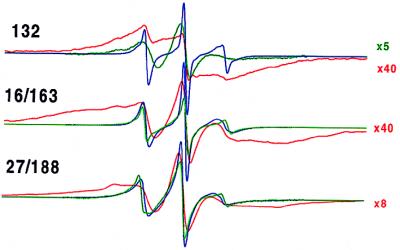
Figure 2.
EPR spectra for annexin XII mutants 132R1, 16R1/163R1, and 27R1/188R1 in solution at pH 7.4 (blue trace), membrane-bound at pH 7.4 with 1 mM Ca2+ (red trace), and membrane-bound at pH 4.0 (green trace). The reference spectra at pH 7.4 were reproduced from ref. 3 with permission from the Journal of Biological Chemistry. The amplitudes of certain spectra were increased by a scaling factor shown on the right. The scan width is 100 G.

