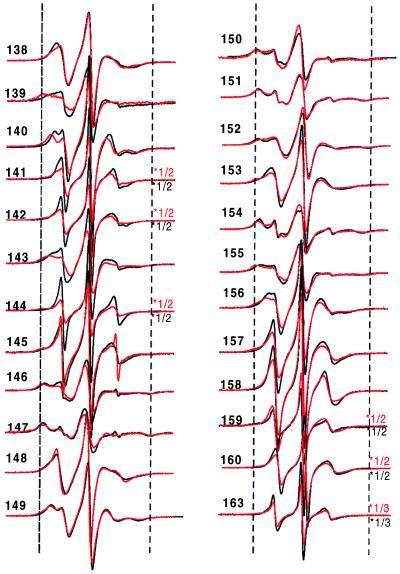
Figure 3.
EPR spectra of annexin XII containing the R1 nitroxide side chain at the indicated sites in solution at pH 7.4 (black line) and pH 4.0 (red line). The spectra within a pair are normalized to the same number of spins. For convenience of presentation, the amplitudes of some spectra were reduced by the scaling factor shown to the right of the spectra. The dashed vertical lines are drawn to aid in comparison of spectral features. The scan width is 100 G.

