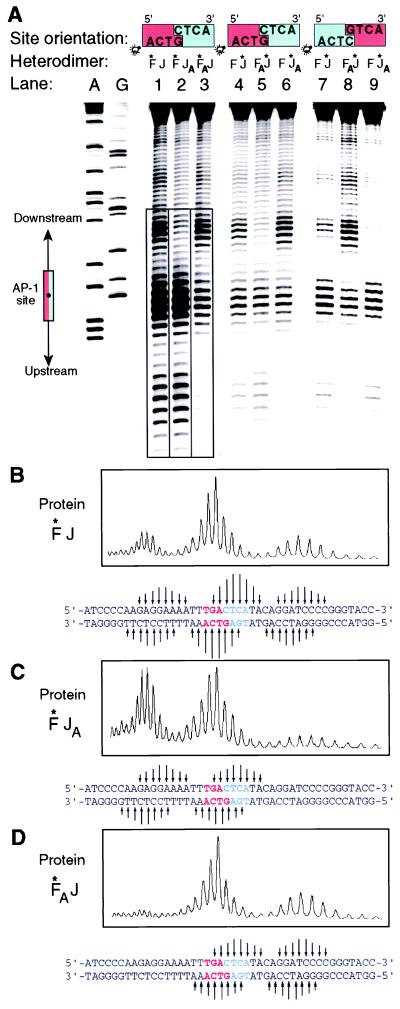
Figure 2.
Affinity cleavage of DNA by Fe(III)-EDTA-modified peptides. (A) Autoradiogram of a DNA sequencing gel analyzing the products of affinity cleavage. The orientation of the site is depicted at the top, with the GTCA half-site in red and the CTCA half-site in blue. The end bearing the 33P label is indicated by a light bulb. The diagram on the far left depicts the location of consensus AP-1 site. A and G refer to the Maxam-Gilbert A- and G-specific reactions, respectively, used as sequence markers. Boxed lanes on the autoradiogram indicate those that were phosphorimaged to produce B-D. (B-D) Phosphorimage analysis of affinity cleavage reactions. Arrows under the panels denote the locations of cleaved bases, with the length being roughly proportional to the relative intensity of the cleavage.

