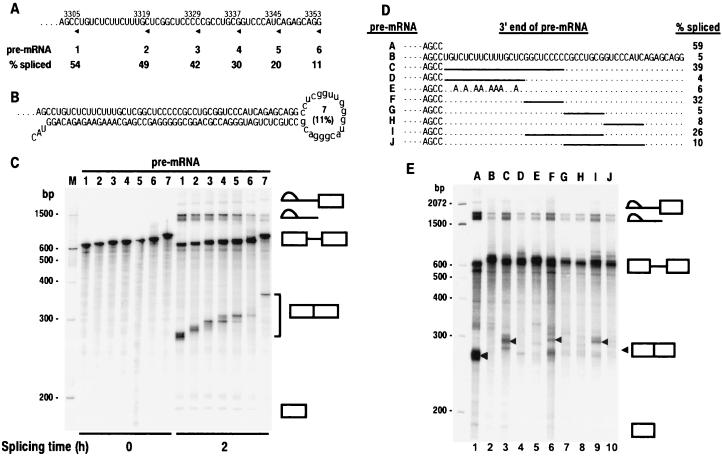
Figure 3.
Mapping analysis of the BPV-1 ESS by deletion and point mutagenesis. (A) 3′ deletion of the ESS in a BPV-1 late pre-mRNA. The sequence of the ESS is shown. All of the pre-mRNAs also contain SE1. The 3′ end of each pre-mRNA is indicated by an arrowhead under the sequence and a number above the sequence that indicates the nucleotidet position of the 3′ end. The pre-mRNAs are labeled 1–6 and correspond to each pre-mRNA used for splicing in C. Splicing efficiency (% spliced) was calculated from the data in C as described in Materials and Methods and is shown under the pre-mRNA number. (B) The structure of pre-mRNA 7. It is a BPV-1 late pre-mRNA containing both a sense and an antisense ESS sequence downstream of SE1 in exon 2. The number in parentheses in the loop indicates the splicing efficiency of the pre-mRNA calculated from the data in C. (C) In vitro spliced products of pre-mRNAs shown in A and B. Positions of DNA size markers corresponding to a 100-bp ladder are shown at the left of the gel. The identity of the spliced products and intermediates is shown at the right. Unincubated pre-mRNA (0 h) was included as a control. (D) Sequence of wild-type or mutant ESS in BPV-1 late pre-mRNA. Small dashes on the left represent the sequences (including SE1) upstream of ESS. Periods and solid lines indicate unchanged nucleotides and deletions, respectively. Pre-mRNAs are identified at the left by the letters A–J. Splicing efficiency of each pre-mRNA was calculated based on the gel profile in E. (E) Splicing gel electrophoresis after in vitro splicing reactions of 32P-labeled pre-mRNAs in D. The identity of the spliced products and intermediates is shown at the right with an arrow for the fully spliced product. Positions of DNA size markers corresponding to a 100-bp ladder are shown at the left of the gel. The letters A–J at the top of the gel represent the pre-mRNAs in D that were used for the splicing assay.

