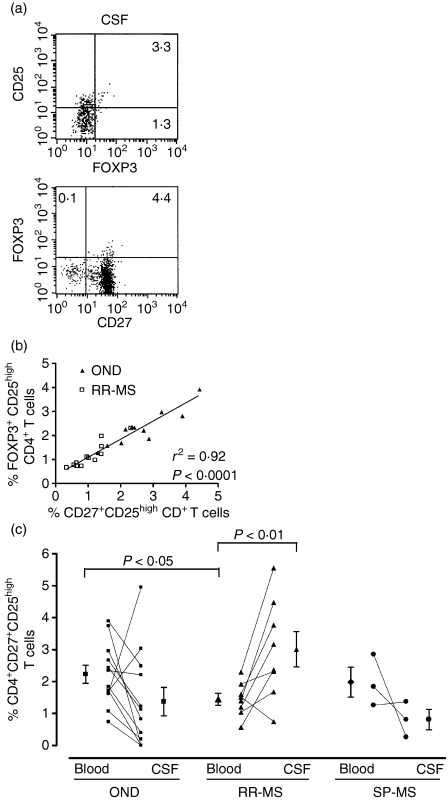
Figure 5.
Analysis of regulatory T cell (Treg) frequency in the cerebrospinal fluid (CSF) of patients with multiple sclerosis (MS) and patients with other neurological diseases (ONDs). (a) Flow cytometric analysis of forkhead box P3 (FOXP3), CD25 and CD4 on cells isolated from the CSF of relapsing-remitting multiple sclerosis (RR-MS) patients. The dot plots shown are representative for data obtained from two RR-MS patients. (b) Percentages of CD27+ CD25high and FOXP3+ CD25high CD4+ T cells (within the total CD4+ T-cell population) were determined by flow cytometric analysis of peripheral blood mononuclear cells (PBMC) isolated from 11 OND and 12 RR-MS patients. The cut-off value for high staining of CD25 was set at a constant value (102) to allow comparison between the T-cell subsets. The percentages of CD27+ CD25high and FOXP3+ CD25high CD4+ T cells were significantly correlated (P < 0·0001) in the PBMC of the same individuals as measured by linear regression analysis (r2 = 0·92). (c) Frequency of CD4+ CD27+ CD25high T cells in paired peripheral blood and CSF samples of 12 OND, eight RR-MS and three SP-MS patients.

