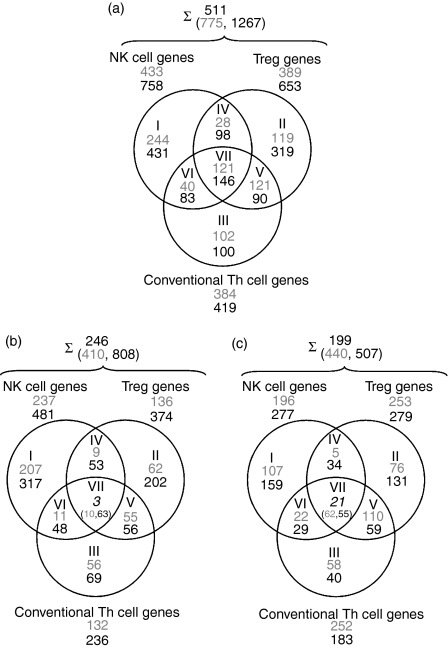
Figure 1.
Venn diagrams of microarray results for natural killer T (NKT) cells compared with natural killer (NK) cells, NKT cells compared with CD4+ CD25–[conventional T helper (Th)] cells, and NKT cells compared with CD4+ CD25+ cells [T regulatory cells (Treg)] from spleens of C57BL/6 mice. NKT cell RNA was used in all comparisons as a common reference. (a) A summary of the genes that are differentially expressed in the cell types described. (b) Up-regulated genes: up-regulated in all other cell types compared with NKT cells. (c) Down-regulated genes: down-regulated in all other cell types compared with NKT cells, i.e. up-regulated genes in NKT cells. Roman numerals represent the Venn diagram subsets, and Arabic numerals the number of genes: grey, results from the first experimental set; black, results from the second experimental set; italic, intersection of genes from both experiments that were up- or down-regulated in all other cell types compared with NKT cells. Accession numbers and fold change expression differences for listed genes are available in the online Supplementary material (Table S1). Numbers after the summation sign represent the intersection of differentially regulated genes of the first (grey) and second (black) experimental set. The upper number represents the intersection of differentially expressed genes in both experimental sets.

