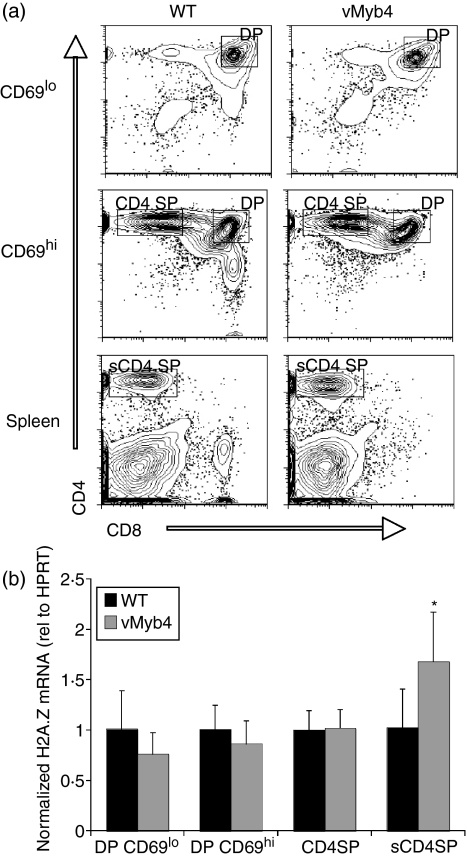
Figure 2.
Elevated histone variant H2A.Z mRNA in vMyb4 T-cell populations in vivo. (a) Flow cytometry of thymocytes (top and centre panels) and splenocytes (bottom panels) from vMyb4 transgenic mice and wild-type littermate controls (WT), stained with anti-CD4 and anti-CD8 antibodies. (b) Quantitative reverse transcription–polymerase chain reaction (qRT-PCR) analysis of H2A.Z mRNA expression using RNA from sorted T lymphocytes. Data are presented as means from triplicate qRT-PCR reactions performed from each of three independent sorts. Error bars represent standard error. DP, double positive; HPRT, hypoxanthine-guanine phosphoribosyltransferase.

