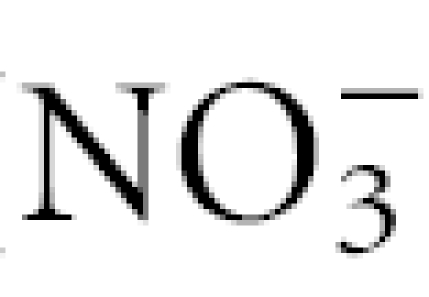
Table 2.
Serum nitrate levels of mice infected with of S. schenckii treated or not with NOS inhibitor
| Infection/treatment |
 (μm)1 7th day (μm)1 7th day |
14th day | 21st day |
|---|---|---|---|
| Non-infected/– | 17 ± 6·7 | 24 ± 9·6 | 15 ± 9·7 |
| Non-infected/N-Arg | 12 ± 9·1 | 13 ± 8·7 | 12 ± 8·6 |
| Yeast infected/– | 255 ± 531 | 360 ± 59* | – |
| Yeast infected/N-Arg | 27 ± 9·5 | 37·7 ± 10·2 | 33·6 ± 15 |
Data are represented as nitrate (μm). Nitrate levels were assayed on 7th, 14th and 21st day after infection with S. schenckii. Animals were daily treated with 50 mg/kg of N-Arg.
P < 0·05 compared to non-infected mice.
