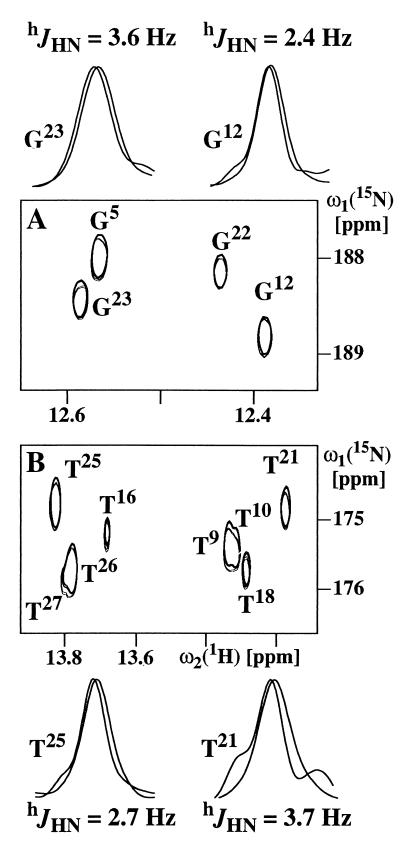
Figure 3.
NMR observation of scalar 1H—15N couplings across hydrogen bonds in DNA, hJHN. The plots show comparisons of the sum and difference 2D hJNN-correlation-[15N,1H]-TROSY spectra recorded with the uniformly 13C,15N-labeled DNA duplex (Fig. 1A) on a Bruker DRX-750 spectrometer, using the experimental scheme of Fig. 2. (A and B) Contour plots with signals from G C base pairs and A⩵T base pairs, respectively. To facilitate comparison, one spectrum was shifted relative to the other by ≈90 Hz along ω2(1H), so that corresponding peaks overlap along this dimension. The relayed cross-peaks from each of the two spectra are represented by two contour lines. For selected base pairs, superpositions of cross sections along ω1(15N) taken through the original, unshifted peaks are shown above and below the two panels, where the two peaks to be compared have been normalized to the same intensity. The shift between the two peaks provides an E.COSY-type representation of hJHN (see text).

