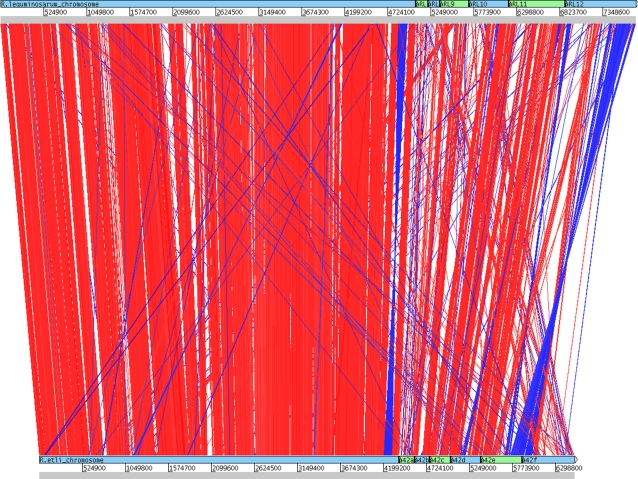
Figure 2. ACT View of Chromosome and Plasmids.
The chromosomal and plasmid DNAs have been laid end-to-end and analysed using the Artemis comparison tool (ACT) [15]. Red bars represent close matches, whilst blue bars represent inverted close matches. The R. leguminosarum genome is at the top of the figure with replicons in the order Chromosome, pRL7, pRL8, pRL9, pRL10, pRL11, pRL12 whilst the R. etli genome is shown at the bottom of the figure in order Chromosome, p42a, p42b, p42c, p42d, p42e, p42f.

