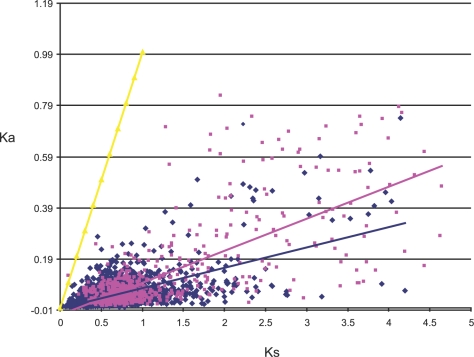
Figure 5. Rates of synonymous (Ks) and non-synonymous substitutions (Ka) in orthologous genes of R. etli and R. leguminosarum.
- Neutrality line (Ka = Ks) is indicated in yellow. Linear regressions for CO class (blue color line and diamonds) and NC class (rose color line and diamonds) are indicated. As neutrality assumes equal nucleotide substitutions rates per synonymous and non-synonymous sites, points under the neutrality line indicate negative selection. Strong selective constraints are acting on genes of the CHR-O class (R2 = 0.6124; P≪0.001) but are slightly less intense for some genes of the N-CHR class (R2 = 0.5094), as can be seen by the dispersion of the rose color diamonds.

