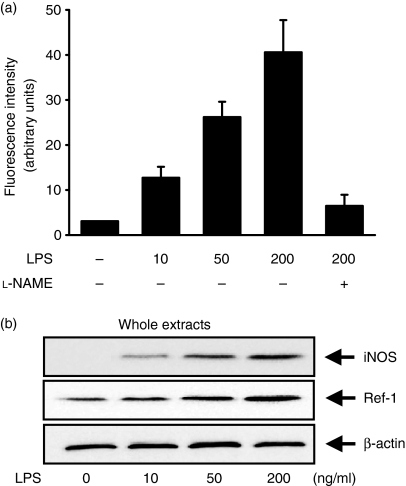
Figure 1.
LPS increases NO production and Ref-1 protein levels in the macrophage cell line RAW 264.7. (a) Fluorescence intensity by NO indicator. Cells were stimulated for 12 hr with the indicated concentrations of LPS. Then, the cells were washed and incubated for another 1 hr in KRP buffer containing DAF2 in the presence or absence of l-NAME (1 mm). In supernatants, NO production was measured with a fluorescence microplate reader. (b) After stimulation with LPS for 24 hr, the cell lysates were analysed by Western blotting using antibodies for iNOS and Ref-1. β-Actin was used as an internal control to monitor equal protein loading. For (a), values are presented as means ± SD of three independent cell preparations. Differences between means were compared using Student's t-test (P < 0·05).

