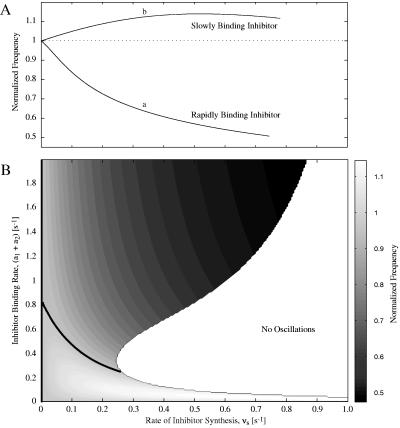
Figure 2.
Simulation results for frequency modulation of the Goldbeter CDC model. Frequencies are normalized to the natural frequency (fn) of the CDC oscillator, i.e., the frequency when no inhibitor is present (fn = 0.0518 min−1). The rate of inhibitor binding is quantified as the sum of the inhibitor rate constants, a1 and a2. The dissociation constant for the inhibitor is Kd = a2/a1 = 1.0. Parameter values for the Goldbeter model are: vi = 0.1 min−1, k1 = 0.5 min−1, kd = 0.02 min−1, K1 = K2 = 0.06, K3 = K4 = 0.1, K5 = 0.02, K6 = 0.3, V1′ = 0.75 min−1, V2 = 0.25 min−1, V3′ = 0.3 min−1, V4 = 0.1 min−1, d1 = 0.05 min−1, α = 0.1. (A) Effect of vs, the rate of inhibitor synthesis, on CDC frequency for two inhibitor binding rates: (a1 + a2) = 1.4 min−1 (curve a) and (a1 + a2) = 0.06 min−1 (curve b). (B) Contour plot showing the effects of vs and the inhibitor binding rate on the CDC frequency. Oscillations at the natural frequency (fn) are marked by the thick black contour line. Above the fn contour, the frequency of oscillations is reduced; below the contour, the frequency is increased.

