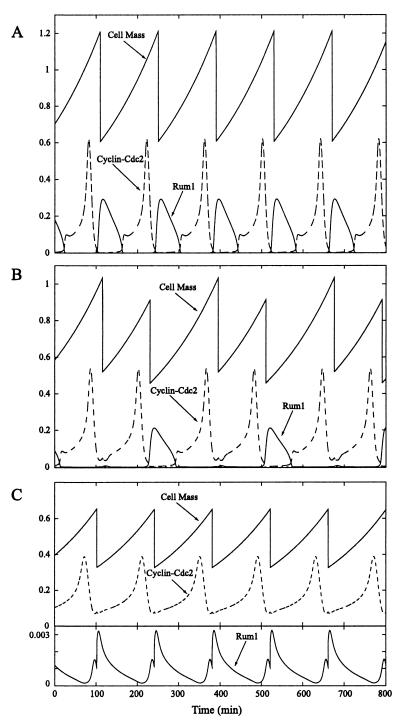
Figure 7.
Effect of inhibitor on Novak–Tyson model when G1/S mass control checkpoint is active. (A) Stable oscillations when inhibitor is not expressed. (B) Stable period-2 oscillations when a slowly binding inhibitor is expressed at a low level (vs = 0.055 min−1). (C) Stable oscillations when a slowly binding inhibitor is expressed at a high level (vs = 0.1 min−1). Mean cell mass is reduced.

