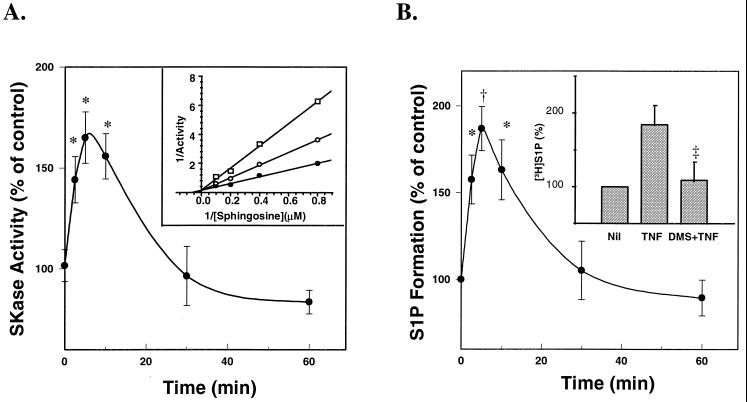
Figure 3.
TNFα-induced SKase activation. (A) HUVEC treated with TNFα (TNF, 100 units/ml) at the desired time points, the cytosolic fractions were extracted to measure SKase activity. (Inset) Kinetic study of SKase. The cell extract was prepared from the cells treated with 100 units/ml TNFα for 5 min. The kinase assay was performed with various concentrations of sphingosine in the absence (•) or presence of 5 μM (○) or 10 μM (□) DMS. (B) After treatment with TNFα as described above, the cells were permeabilized to measure the production of S1P in vivo. (Inset) S1P levels in intact cells measured by labeling with [3H]serine. The data in A and B are mean values ± SD of three individual experiments. ∗, P < 0.01; †, P < 0.001, vs. the basal levels; ‡, P < 0.001, vs. TNFα stimulation.

