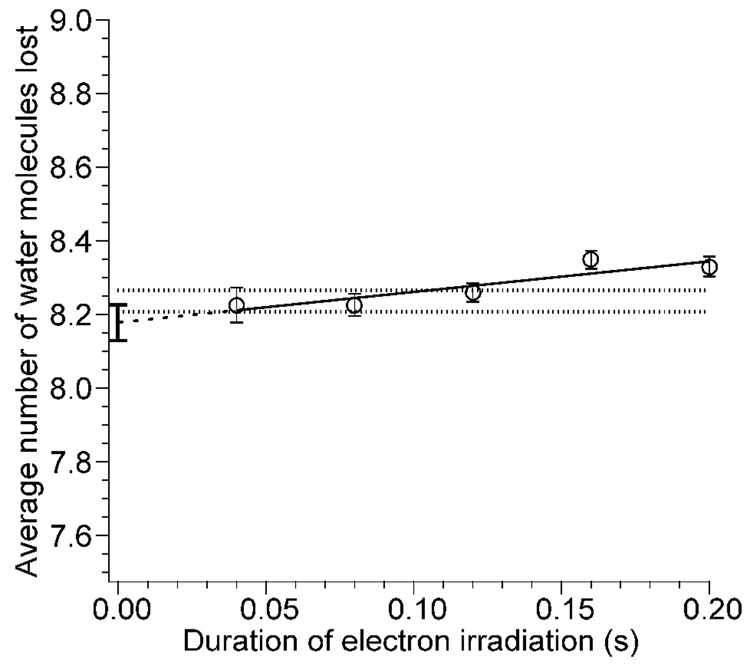
Figure 4.
Average number of water molecules lost from reduced [Ca(H2O)15]2+ due to EC as a function of electron irradiation time. The dashed line indicates the extrapolated least squares fit to the data, and the error bars at 0.0 s indicate the propagated error in the intercept. The dotted lines represent one standard deviation above and below the average value of the data at 40, 80, and 120 ms.

