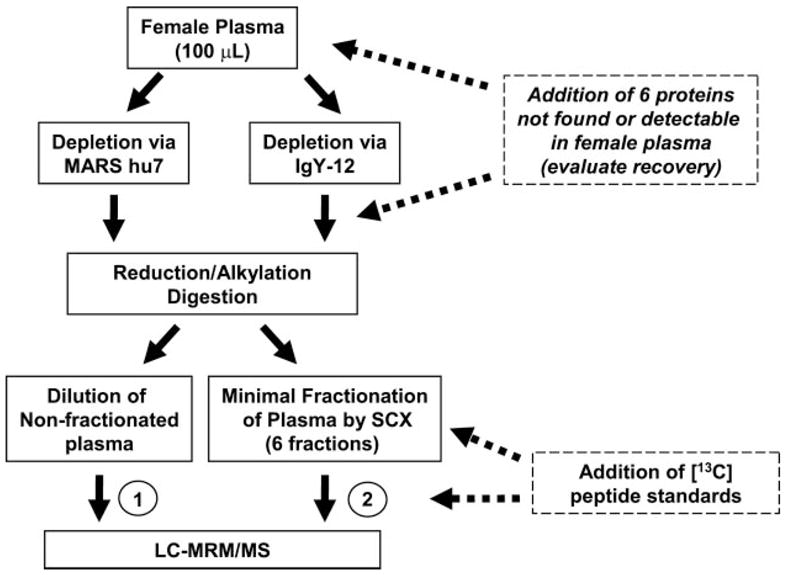
Fig. 1. Experimental flow diagram for LOQ studies.

Female plasma from a healthy donor was immunoaffinity depleted of 7 and 12 high abundance proteins via commercial affinity columns. Proteins listed in Table I were added to depleted plasma at 0, 2.5, 5, 10, 25, 50, 100, 250, and 500 ng/ml prior to reduction, alkylation, and digestion. Two separate processing paths were followed after proteolytic digestion. In path 1 (left), digested plasma was diluted to yield ≤1 μg of total protein on column, and internal standards were added just prior to LC-MRM/MS. In path 2 (right), peptides were separated by SCX, and internal standards were added to corresponding SCX pooled fractions prior to LC-MRM/MS. All MRM analyses were performed in triplicate.
