
Fig. 2. Calibration curve for quantifying mouse leptin in MARS hu7 and IgY-12 depleted plasma.
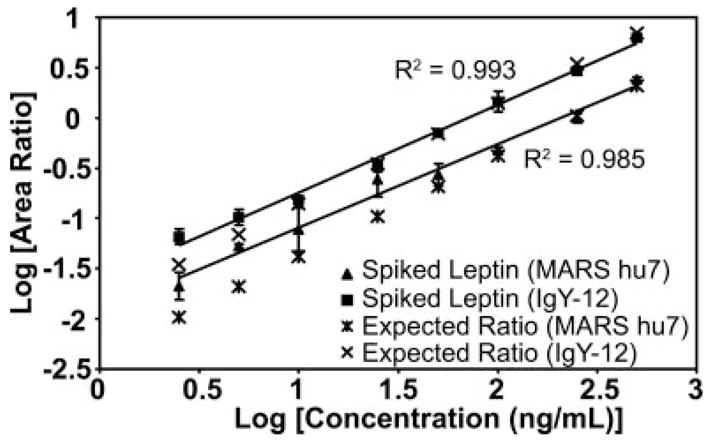
The area ratio of light peptide to heavy peptide was determined from the extracted ion chromatograms of the 467.2/643.8 and 468.9/646.3 transitions, respectively, and plotted versus protein concentration. Three biological replicates for each concentration point were generated in MARS hu7 (closed triangle) and IgY-12 (closed square) depleted plasma and analyzed in triplicate by MRM (n = 9). Error bars indicate S.D. of the measurements. Raw data are shown in Fig. 3.