Figure 6.
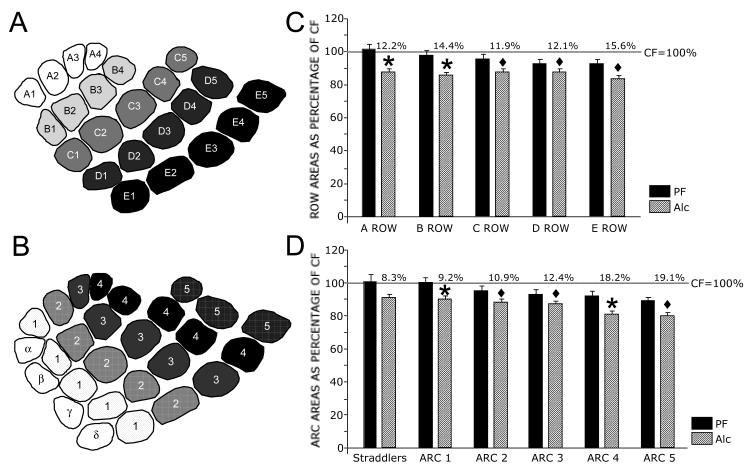
Averaged PMBSF row and arc areas in Alc and PF rats compared to CF rats at 7-months of age. Schematic diagrams showing barrel rows (A) and arcs and straddler barrels (B). C Graph showing average percent row area for Alc and PF rats normalized as a percentage change of CF rats. Significant reductions in row area were observed between Alc and non-alcohol rats. No significant row differences occurred between CF and PF groups. Percent reduction in row area between Alc and CF is indicated above the bars of each row. D Graph showing averaged percent arc and straddler areas for Alc and PF rats normalized as a percentage change of CF rats. The straddler arc showed no significant difference between Alc and CF, while arcs 1–5 were significantly reduced from CF or both CF and PF groups. No significant differences occurred between CF and PF arc areas. Percent reduction in arc area between Alc and CF is indicated above the bars of each arc/straddler. Gray lines in C and D indicate normalized CF values at 100%. Diamond (◆) indicates significant difference between Alc and CF. Asterisk (*) indicates significant difference between Alc and both non-alcohol groups.

