
Figure 3.
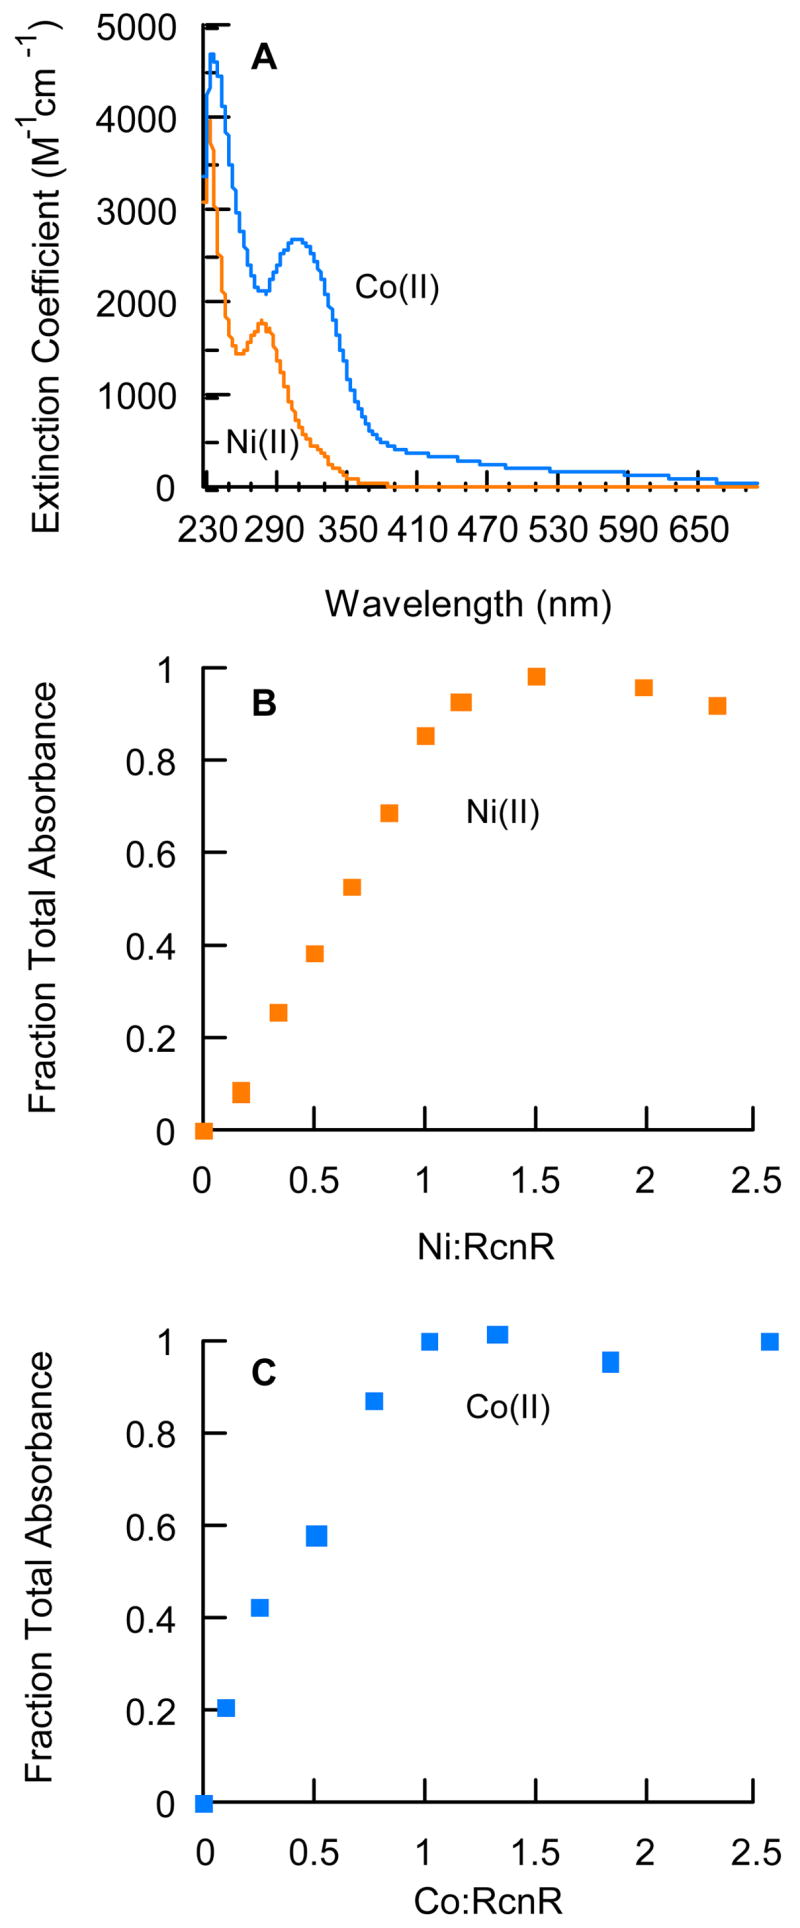
Electronic Spectroscopy of Ni or Co-substituted RcnR. (A) UV-visible difference spectra of 1:1 Ni(II)-RcnR (60 μM) (orange line) and 1:1 Co(II)-RcnR (85 μM) (blue line) were obtained in Buffer M. A metal-free sample was subtracted to obtain the difference spectrum. Data were collected every 0.5 nm. (B) Stoichiometric addition of NiCl2 to RcnR (60 μM). (C) Stoichiometric addition of CoCl2 to RcnR (88 μM). The absorbance signal saturated at 1.0 Co/monomer and 1.2 Ni/monomer under the same solution conditions as in (A).