
FIGURE 8. Spectral Mapping of ϕ,ψ Torsion Angles.
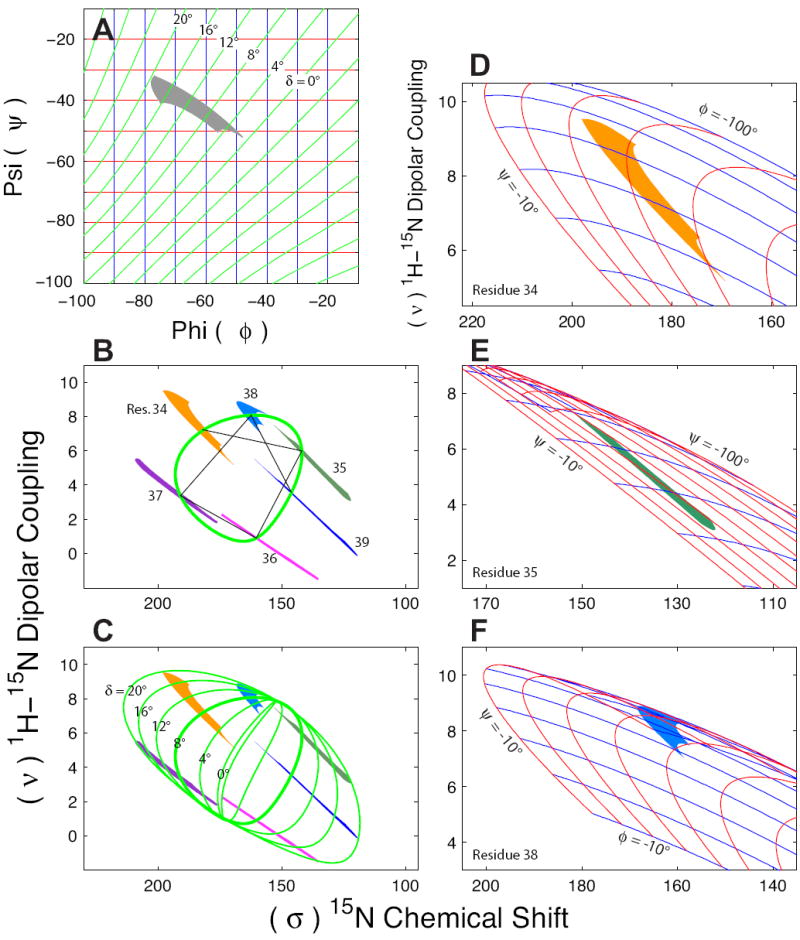
The hydrogen bond geometry restrained torsion angle region for transmembrane α-helices in,ϕ,ψ torsion angle space is illustrated with a Ramachandran-δ diagram (A) as in Fig. 7 C. Throughout this figure the δ contours are in green and the ϕ,ψ contours are in blue and red, respectively. The restrained torsion angle region was used to create the mapped frequency range for residues 34-39 of M2-TMD (Wang, et al., 2001) that are overlaid onto a PISA wheel (green line, δ = 8°) with a helical tilt of 38° and lines demonstrating the sequential connectivity of resonances (black line) (B). The δ-contours from ϕ,ψ torsion angle space are mapped to the PISEMA spectra as PISA wheels (C) (green lines). Just as the restrained region of torsional space is contained between the δ = 0° and δ = 20° contours in the Ramachandran-δ diagram (A), the PISEMA spectral space is contained within the δ = 0° and δ = 20° PISA wheels (C). PISEMA spectral space with overlaid ϕ,ψ torsion angle grids are shown for residues 34 (D), 35 (E) and 38 (F) as examples. These three resonances demonstrate the compression of torsion angle grids along both ϕ and ψ as well as twisting and folding of torsional contours in the PISEMA spectral space.