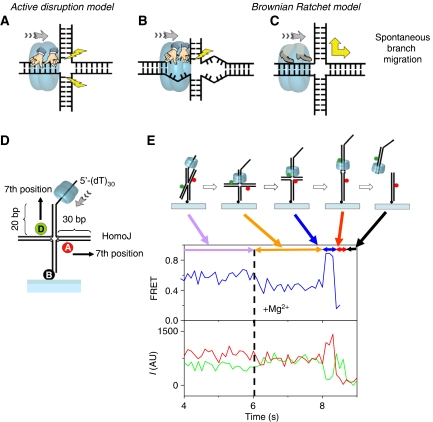
Figure 1.
Helicase-catalysed branch migration. (A–C) Schematic representation of the models discussed in this work. (A) Active disruption by simultaneous unwinding of two arms. (B) For the active disruption model, extensive heterology can lead to inefficient unwinding, as only one arm is being pulled. (C) The Brownian ratchet model involves junction opening and rapid spontaneous branch migration, which is biased by the directional movement of the helicase. (D) Schematic representation of substrate and initial binding site. (E) Typical single-molecule FRET intensity and FRET efficiency (blue curve) time traces for a branch migration reaction. Acceptor (A in the figure, Cy5) is in red and donor (D in the figure, Cy3) in green. The fraction of molecules that show complete reaction is 57% (301 molecules out of 529 molecules in four independent experiments), which is comparable to results in bulk solution. The segments and the scheme represent the different stages of the reaction.

