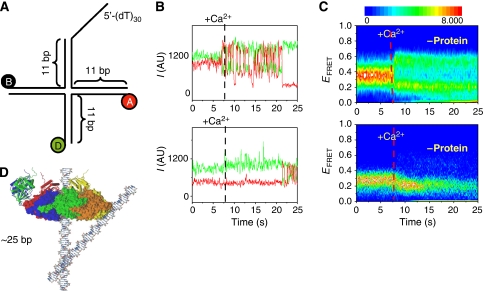
Figure 4.
(A) DNA substrate (MonoJ) used for measuring the effect of helicase binding and translocation on junction folding. (B, C) Stacking conformer transitions of a junction (MonoJ) with (top panels) and without (bottom panels) protein. (B) Single-molecule time traces on addition of Ca2+ at about 7 s. (C) The density plot shows a synchronized behaviour of ∼120 molecules at a time (Blanchard et al, 2004). The colour scale is proportional to the number of molecules with a given FRET value at a given time. Protein (bottom panels) was added at a concentration of 150 nM in the presence of dTTP (2 mM) and allowed to incubate as in experiments in Figure 1E before the addition of Ca2+. (D) Overlap of crystal structures of a Holliday junction and T7 helicase (Toth et al., 2003) indicating the relative size of both structures (figure courtesy of Jin Yu).

