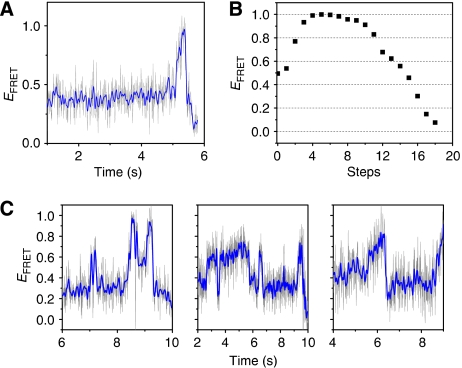
Figure 5.
(A) Single-molecule FRET efficiency time traces for the catalysed branch migration reaction obtained at 23°C with 8 ms time resolution showing the junction moving unidirectionally. (B) Step-by-step FRET efficiency estimated from the crystal structure of an open Holiday junction (Ariyoshi et al, 2000) assuming R0=55 Å. (C) FRET efficiency trajectories at 17°C with 8 ms time resolution showing fluctuations consistent with random excursions of the junction. High time resolution data are from HomoJ and HomoJ/L16, identical to HomoJ but labelled at the 16th positions. Grey lines are raw data and blue lines are 5 points averaged data. Experiments were performed by following the same procedure as experiments described in Figure 1E.

