
Figure.
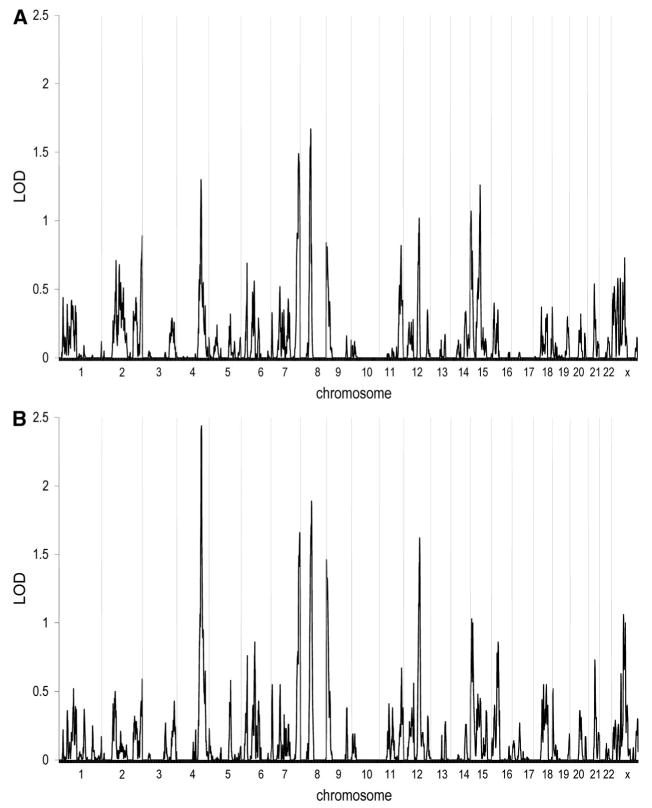
Results of multipoint model-independent linkage analysis. The x-axis depicts the various chromosomes across the genome with chromosome 1 at the far left and the X chromosome at the far right. The y-axis indicates the LOD score at the various chromosomal positions across the genome. A, Narrow disease definition (n=170 families); B, Broad disease definition (n=192 families).